Inspired by recent events1, I’ve polished and released one of the tools I built a few months ago to investigate agile electricity pricing from Octopus Energy2.
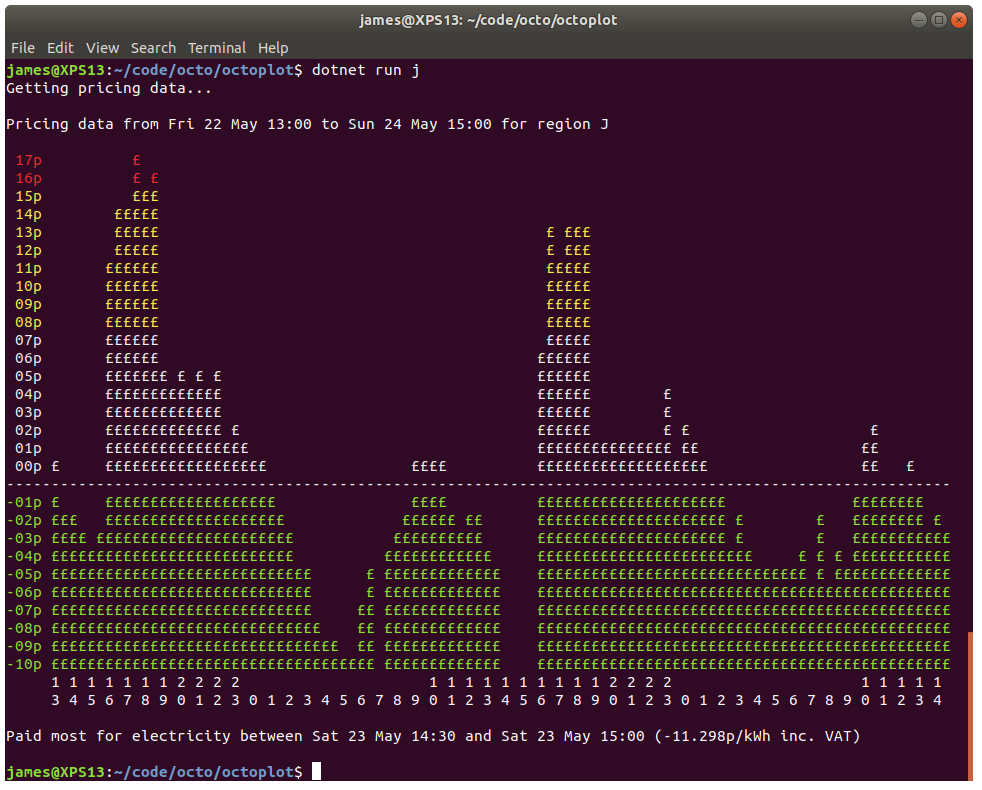
I spend a lot of my day in a (Linux) terminal and it is convenient to check things from there rather than have to switch to some bloated software. So, I made a little utility called OctoPlot that draws a colourful graph of the latest agile pricing data in your terminal.
I’ve built self-contained binaries for the most common platforms (including ARM for Raspberry Pi OS) or you can compile and run it from the source code.
Example Outputs
Getting pricing data...

Pricing data from Fri 22 May 13:00 to Sun 24 May 15:00 for region P

 18p
 17p          £ £
 16p          £££
 15p        £ £££
 14p        £££££
 13p        £££££                                           £ £££
 12p        £££££                                           £ £££
 11p       ££££££                                           £££££
 10p       ££££££                                           £££££
 09p       ££££££                                           £££££
 08p       ££££££                                           £££££
 07p       ££££££                                           £££££
 06p       £££££££                                         ££££££
 05p       £££££££ £ £ £                                   ££££££
 04p       £££££££££££££                                   ££££££        £
 03p       £££££££££££££                                   ££££££        £ £
 02p       £££££££££££££ £                                 ££££££        £ £                    £
 01p       ££££££££££££££££                                £££££££££££££££££££                 ££
 00p £     ££££££££££££££££££                ££££          £££££££££££££££££££                 ££   £
---------------------------------------------------------------------------------------------------------
-01p £     £££££££££££££££££££               ££££          ££££££££££££££££££££                £££££££
-02p £££   ££££££££££££££££££££             £££££  £       £££££££££££££££££££££ £        £   ££££££££ £
-03p ££££ ££££££££££££££££££££££            £££££££££      £££££££££££££££££££££ £        £   £££££££££££
-04p £££££££££££££££££££££££££££          ££££££££££££     £££££££££££££££££££££££      £ £ £ £££££££££££
-05p £££££££££££££££££££££££££££        £ ££££££££££££     ££££££££££££££££££££££££££   £ £ £££££££££££££
-06p £££££££££££££££££££££££££££££      £ £££££££££££££    ££££££££££££££££££££££££££££££££££££££££££££££
-07p £££££££££££££££££££££££££££££     ££ £££££££££££££    ££££££££££££££££££££££££££££££££££££££££££££££
-08p ££££££££££££££££££££££££££££££    ££ £££££££££££££    ££££££££££££££££££££££££££££££££££££££££££££££
-09p ££££££££££££££££££££££££££££££    ££ £££££££££££££    ££££££££££££££££££££££££££££££££££££££££££££££
-10p ££££££££££££££££££££££££££££££££ £££ £££££££££££££    ££££££££££££££££££££££££££££££££££££££££££££££
-11p ££££££££££££££££££££££££££££££££££££ £££££££££££££    ££££££££££££££££££££££££££££££££££££££££££££££
     1 1 1 1 1 1 1 2 2 2 2                     1 1 1 1 1 1 1 1 1 1 2 2 2 2                     1 1 1 1 1
     3 4 5 6 7 8 9 0 1 2 3 0 1 2 3 4 5 6 7 8 9 0 1 2 3 4 5 6 7 8 9 0 1 2 3 0 1 2 3 4 5 6 7 8 9 0 1 2 3 4

Paid most for electricity between Sat 23 May 14:30 and Sat 23 May 15:00 (-12.327p/kWh inc. VAT)
Usage
There are instructions in the repository on how to run the tool. Pricing varies for each region of the country so you will need to suffix the command with the letter for the region that you want to graph.
These are the group IDs for the Grid Supply Points of the Distribution Network Operators in GB. They aren’t case sensitive as a parameter for my tool.
East England: A
East Midlands: B
London: C
North Wales: D
West Midlands: E
North East England: F
North West England: G
South England: H
South East England: J
South Wales: K
South West England: L
Yorkshire: M
South Scotland: N
North Scotland: P
OctoPlot is built with .NET Core (Microsoft are dropping the Core bit in the next version) so you will need to install the SDK if you want to build it from source.
Closing
This is just one of the tools I built to investigate agile electricity pricing. I plan to release more of them soon.
Let me know how you get on. Enjoy!
- For most of Saturday 23rd May (until 4pm) Octopus Energy would have barely charged or even paid you for the electricity that you used (over 12p/kWh earned for an hour in one region!). ↩
- If you want to switch to 100% green energy that regularly pays you to use it then you can get £50 off with this referral link. It’s one of the simplest and easiest things you can do to help tackle the climate crisis. ↩